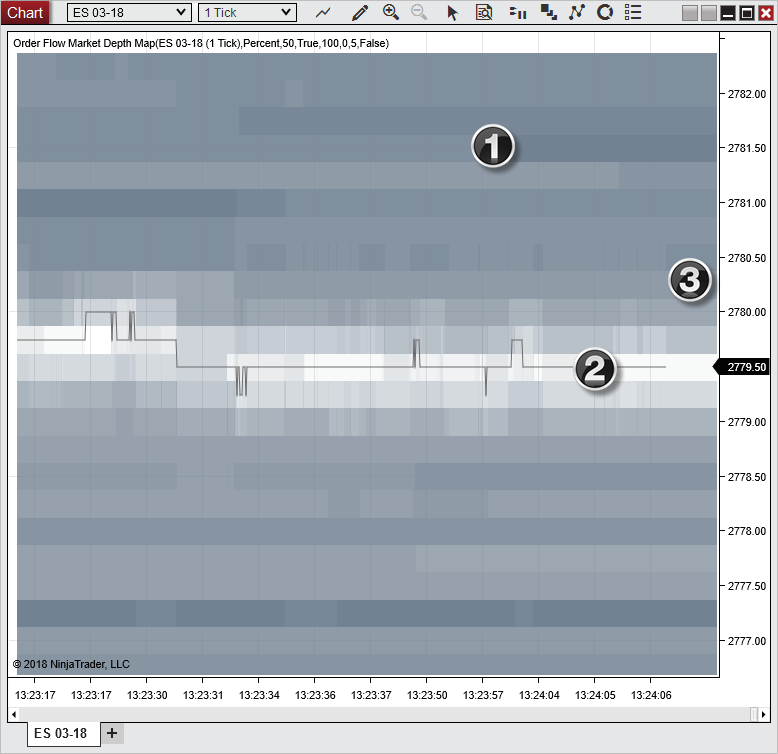
To add the Order Flow Market Depth Map on your Ninja Mobile Trader VPS, open a NinjaTrader chart’s Indicators window and add the map with active Order Flow+ access and a Level II feed. It displays received market depth by price and bar.
We specialize in hosting NinjaTrader Desktop on Windows. Configure the chart in your hosted installation, then access that same workspace across supported devices. Our VPS subscriptions include Windows licensing and 24/7 VPS support.
The image above is NinjaTrader’s historical example. Its contract, prices and numbered callouts illustrate the display; they are not current market data.
Confirm access and depth data#
Check that your NinjaTrader account has active Order Flow+ access under the dashboard’s Settings → Plans. NinjaTrader’s current entitlement instructions explain how to confirm it.
Separately, verify that your connection supplies Level II market depth for the instrument. A Level I quote feed is insufficient. Available depth depends on the provider, and NinjaTrader’s Market Depth Map documentation states that equity instruments are not supported.
Add the map to a chart#
- Open a chart for the intended supported instrument and interval.
- Right-click an empty area of the chart and select Indicators.
- Select Order Flow Market Depth Map from the available indicators and click Add.
- Select the configured indicator, adjust its properties and click OK.
These follow NinjaTrader’s indicator configuration procedure. The map begins plotting depth received in real time after it is applied.
Start with a simple chart and change one display setting at a time:
| Setting | What it changes |
|---|---|
| Display mode | Choose realtime depth, historical depth, or both |
| # of market depth levels | Set how many bid and ask levels to display, within the depth your provider supplies |
| Base volume range on | Use Percent or Exact volume; minimum and maximum values define the opacity range |
| Opacity distribution | Low emphasizes transparency; High makes more values opaque; Normal distributes opacity evenly |
| Extend last known volume | Carry a price level’s earlier depth value into later bars until new depth arrives there |
NinjaTrader documents these controls in its current Market Depth Map walkthrough.
Read the shading correctly#
The map records the highest received depth volume at each price level within each bar. More opaque shading represents greater depth within the configured range. Even the realtime display reflects the highest received depth during the forming bar, so it can differ from the current ladder value.
With Extend last known volume enabled, a shaded level may carry an earlier value forward. That shading alone does not confirm a fresh update at that price, a still-resting order or an execution.
Use our SuperDOM guide for the interactive price ladder. Use our volumetric-chart guide for executed volume at price. They answer different questions from this depth map.
Verify and save the display#
While depth updates arrive, observe the bid and ask shading and the forming bar. Change one opacity or level setting and check the visible result. No order is needed for this display check.
Save the arrangement using our workspace and chart-template guide. If the map becomes part of a larger chart or strategy workload, use the NinjaTrader VPS sizing checklist to assess that complete workload.
Keep your depth charts in one hosted workspace
Access your configured NinjaTrader Desktop installation across supported devices on our Windows VPS, with Windows licensing included and 24/7 VPS support.