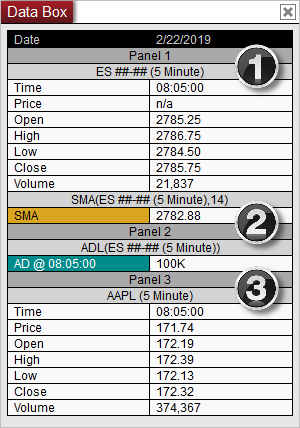
Use NinjaTrader Data Box to read a chart bar’s prices and plotted indicator values. Do this inside your Ninja Mobile Trader VPS, where we host your NinjaTrader Desktop workspace on Windows. You can access the same installation from supported PCs, Macs, phones and tablets, with Windows licensing included and 24/7 VPS support.
Open the display beside your chart#
Right-click your chart and select Show Data Box, as shown in NinjaTrader’s Data Box guide. Move over a bar; verify its date, timestamp and series label. The display follows your pointer between charts.
The official illustration above contains historical example values, not current quotes or NMT trading results.
Confirm what the indicator actually measures#
Data Box identifies an indicator plot’s input-bar timestamp. Its calculation input can differ from its display panel.
For example, a five-minute indicator can be drawn alongside one-minute bars. Compare the timestamp and series name before treating their displayed values as observations from the same bar.
To inspect the configuration, right-click the chart background and open Indicators. Select the study under Configured, then inspect Input series. NinjaTrader’s indicator reference documents selecting an applied price series or another indicator as input. Custom scripts must support that input selection; check their developer’s instructions.
Our multiple-data-series guide covers adding series, choosing panels and setting inputs. Use it if the chart configuration itself needs changing.
Restore a missing row deliberately#
Check the specific object before adding another copy of it:
| Missing information | Where to check |
|---|---|
| A bar series | Open Data Series, select the applied series and enable Display in Data Box. |
| An indicator’s plotted values | Open Indicators, select the configured study and enable Display in Data Box. |
| A value that updates less often than expected | Inspect the indicator’s Calculate setting and its input interval. |
The price-data reference documents the series display switch. The indicator reference separately documents its plot-value switch and calculation timing: bar close, each tick or price change. Keep the calculation mode the study requires; changing a display setting does not redefine its formula.
These are chart values. Check orders, executions and account positions in their respective platform windows before drawing conclusions about trading activity.
Keep the view readable in your hosted workspace#
In Data Box’s right-click Properties, adjust the font and Always On Top setting. Use preset > save for future defaults.
Arrange the chart and box on a larger screen first, then check readability from your next device. In Control Center, open Workspaces, point to the current workspace and choose save, as documented in NinjaTrader’s Workspaces menu guide. Our workspace and chart-template guide covers reusable layouts.
Connect to the same NMT VPS and Windows user when returning. For related Desktop tasks, browse our NinjaTrader VPS guides.
Keep your NinjaTrader charts in one NMT workspace
Organize Desktop on our Windows VPS and return to that setup across supported devices.