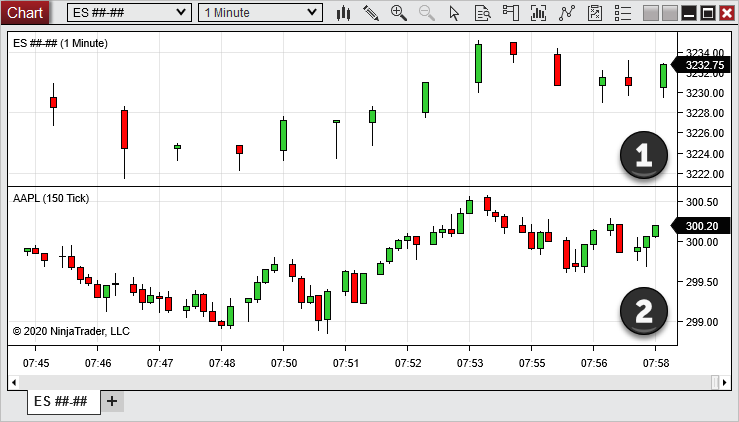
To display multiple data series in one NinjaTrader chart, add each instrument and interval through Data Series, then assign its panel and scale. On Ninja Mobile Trader VPS, make these changes inside your hosted NinjaTrader Desktop installation. We specialize in Windows hosting for NinjaTrader, so you can return to the same chart workspace from supported PCs, Macs, phones and tablets.
Windows licensing is included, with 24/7 VPS support. Use a larger screen for initial layout work; reconnecting from another device gives you access to that Windows setup.
The official NinjaTrader illustration above shows two instruments in separate panels. Its historical prices are an interface example, not a current market view or an NMT performance test.
Add a second interval without replacing the first#
For a simple practice layout, use one instrument you already receive data for, with a one-minute series above a five-minute series. This is a display example, not a trading signal.
In an existing chart:
- Right-click the chart background and open Data Series.
- Use the instrument selector to add the same instrument again. For futures, select the intended contract month.
- Select each entry under Applied and set Type to Minute, with Value 1 for the first and 5 for the second.
- Assign the second entry to New Panel, review both entries, then select OK.
NinjaTrader’s price-data guide documents these controls. Keep the following choices deliberate:
| Setting | Check for this example |
|---|---|
| Instrument | Both entries use the intended symbol and contract. |
| History range | Each loads the period you need. |
| Trading Hours | Both use the intended session template. |
| Label | Each interval remains identifiable. |
As a shortcut, typing +5M into the chart adds a five-minute series of the primary instrument. Omitting the plus changes an existing series instead. The dialog is easier to audit while learning the layout.
Choose panels and scales deliberately#
Separate panels make each interval easier to inspect. Sharing a panel is also supported, but the Panel setting and Scale justification answer different questions: where to draw the series, and which vertical scale it uses.
NinjaTrader’s chart-panel documentation describes Left, Right and Overlay scales. Overlay has no visible price scale of its own; its price markers can appear on another scale. Do not assume two plots share a price scale just because their lines occupy the same space.
For this first layout, retain separate panels and visible right-hand scales. You can temporarily maximize one panel through its price-axis menu, then restore it.
Point each indicator at the intended series#
Adding a second chart series does not by itself specify which one an indicator should calculate from. Open Indicators, select the configured indicator and inspect Input Series.
The platform’s indicator guide lets you choose a price type from an applied series. For example, deliberately select the five-minute series’ Close when that is the intended input, rather than assuming an indicator follows the panel where you placed it.
Setting the indicator’s panel to Same as input series keeps its placement linked to that input. Custom indicators must implement NinjaTrader’s Input interface to use this selection as documented; follow their developer’s instructions.
This article configures chart displays. For custom strategy logic involving several series, use the script’s documented behavior and testing process rather than treating the visible layout as its configuration.
Check the shared timeline before saving#
NinjaTrader’s multiple-series guide explains that the primary series determines bar spacing. Right-click a series’ bars and choose Set as Primary when you intentionally want that series to lead.
When series use different Trading Hours templates, the shared time axis spans their earliest session start and latest session end. A wider timeline therefore does not prove that both instruments have data throughout it.
Before saving, identify both intervals, check their labels and scales, and reopen each indicator’s input selection. Then use our workspace and chart-template guide to preserve the layout. NinjaTrader requires a matching number of series when loading a chart template, and template settings can override manually chosen sessions.
Keep your NinjaTrader charts together on NMT
Build your Desktop workspace on a Windows VPS and access the same installation from supported devices.