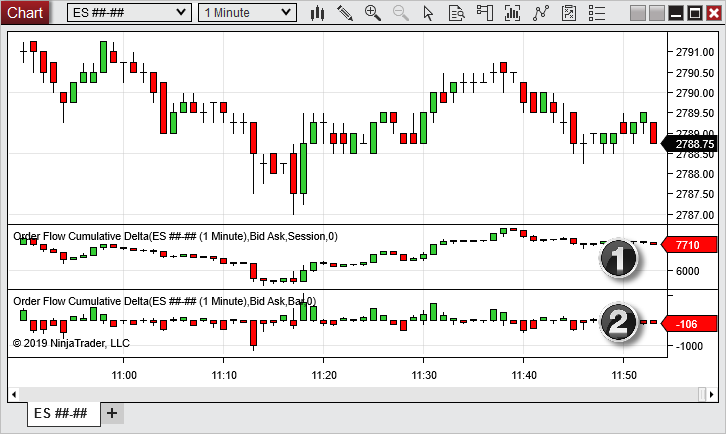
A futures bar can finish with negative delta while the session total is still positive. In NinjaTrader’s example above, the upper indicator panel reads 7,710 for the session and the lower one reads −106 for the latest bar. Both use the same one-minute ES chart and Bid Ask classification. The Period setting explains the difference.
On Ninja Mobile Trader VPS, you configure Order Flow Cumulative Delta in the Windows installation we host. Your chart, feed connection settings and indicator layout stay together when you return from a Mac, PC or supported mobile device.
Add Cumulative Delta to a futures chart#
Confirm that your NinjaTrader account has access to Order Flow+ and that your data connection supplies the tick history you want to study. Cumulative Delta is an indicator in NinjaTrader’s Order Flow+ suite. NinjaTrader Order Flow+ tools
- In your hosted Desktop workspace, open a chart for the futures contract you want to examine. Start with a one-minute chart so the bar boundaries are easy to find.
- Right-click an empty part of the chart and choose Indicators. Select Order Flow Cumulative Delta under Available, then select Add.
- Select the entry under Configured. Check the Input series, then set Delta type, Period and Size filter. Use a size filter of 0 for an initial comparison that includes small trades.
- Select OK. To reproduce the two views in the illustration, add a second instance in a separate panel. Keep the input, delta type and size filter the same. Set one period to Session and the other to Bar. NinjaTrader indicator controls
Choose how trades are classified#
| Delta type | How NinjaTrader assigns the trade volume |
|---|---|
| Bid Ask | A fill at or above the ask contributes to buying volume. A fill at or below the bid contributes to selling volume. A trade inside the spread takes the previous tick’s classification. |
| Up Down Tick | A higher trade price contributes to buying volume and a lower price to selling volume. An unchanged price inherits the previous tick’s classification. |
Delta is the difference between those two volume totals. The Size filter excludes trades smaller than the threshold you set. Keep that threshold visible in your notes when comparing two charts. NinjaTrader Cumulative Delta reference and chart illustration
Check the reset on a closed bar#
With Bar, each delta candle opens at zero. With Session, the previous delta close carries into the next bar within the same session. In the illustrated example, a bar contribution of −106 takes a running total of 7,816 to 7,710. These values measure classified contract volume. The price chart has its own scale.
To check your setup, choose two consecutive closed bars within one trading session. Subtract the earlier Session close from the later one, then compare the difference with the later Bar close. Use the same contract, timestamps, trading hours and filters in both panels.
When live delta updates but older bars look empty#
Historical Bid Ask needs trades stamped with the bid and ask at the time of each tick. Check the provider’s historical coverage for the contract and date range. If only historical trade ticks are available, Up Down Tick answers a different question using price changes. A live quote today cannot reconstruct yesterday’s bid and ask stamps. NinjaTrader data by provider
If you use volume bars, one large trade can span several bars. NinjaTrader documents that its internal one-tick delta series processes that trade’s full volume in the first one-tick bar. Repeat the comparison on a time-based chart when investigating a difference at a volume-bar boundary.
Our NinjaTrader VPS guides also cover Volumetric bars for executed volume at each price and Order Flow VWAP for a volume-weighted average price.
Keep your configured futures charts on one Windows desktop
Return to the same NinjaTrader workspace from your supported devices. Our VPS plans include Windows licensing and 24/7 VPS support.